Página servicio de Babel Sistemas de Información
Data Visualization

- ON-PREMISE
- CLOUD
- HYBRID
- ARTIFICIAL INTELLIGENCE
- DATA
- ANALYTICS
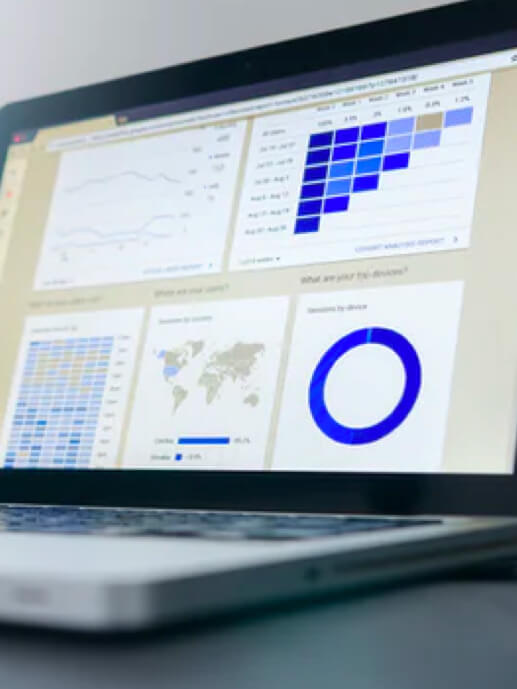
Data visualization occurs at the time the real value is delivered to the user: how the information is represented, the navigability proposal based on different reports, the sequence and distribution of information or adjusting the detail to the required level are essential aspects that condition the success of a data project. For this purpose, Babel has an expert UX team representing data, working with direct involvement in the design and implementation of the different reports or dashboards.
Data Integration
Data Warehouses
KPI Dashboards
What is business intelligence?
From a business perspective, business intelligence or BI is the ability to extract information from data in order to add value to decision-making processes within organisations. From a broader perspective, BI is a concept that combines the strategies and technological tools that help us develop the value extraction process.
In today’s digital world, the possibilities of collecting data are endless, including traditional sources such as each company’s computer systems, data from sensors on IoT devices, and even social networks, to name but a few. It is this diversity that forces us to think of strategies that consider the use of technological tools that can adapt to this variety.


Data Integration
A business intelligence strategy must be based on data availability. Data integration is understood as a process that allows for data to be extracted from various source systems, processed and combined to deliver information that can be use through business intelligence tools.
Traditional data integration is based on extract, transform and load (ETL), although the technological evolution in addition to the wide range of data currently available has given way to tools called data fabric or data factory, which no longer perform the aforementioned tasks but go one step further and deliver data governance, quality and enrichment capabilities, and even contain advanced analytics tools.

From datawarehouse to data virtualisation
Along with the emergence of business intelligence come concepts such as data warehouse and data marts. Both concepts refer to data warehouses where information that is already integrated is stored for subsequent use by business intelligence tools.
Although data warehouse tools have gradually evolved and adapted to the current situation, where data sources tend to be infinite and heterogeneous, new solutions have emerged that deal naturally with this diversity. That is where the concept of data virtualization emerges.
Basically, data virtualization is the implementation of a logical layer that provides access to different data sources without the need to replicate this data in a physical warehouse like data warehouse does. What advantages does this have? Primarily, flexibility in the deployment of solutions and access to real-time or near-real-time information.
Everything finally comes together in display
While the integration and availability of data is an important part of a business intelligence strategy, it will be of no use if we are unable to show the results to end users.
Viewing a business intelligence tool usually involves dashboards and reports. Knowledge of the business and the available data is key here, as it will enable metrics or KPIs to be established that improve strategic areas.
There are wide-ranging solutions, from traditional desktop to cloud-type solutions, that provide online collaboration facilities and facilitate BI self-service tasks, thereby giving the business analyst freedom with regard to advanced technical knowledge.